

GW noise sum.
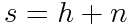
The total noise or measurement error in a measurement can be expressed as the "quadratic sum" of all measurement errors. Any instrument suffers from background "noise". Any observed signal (s) can be divided into two components. That which we wish to observe (h) and "anything else" (n). If these two parts are unrelated, they add linearly.
 In many cases the distinction is obvious. For example a CCD image of a star will be the sum of the effect of the starlight on the camera plus the effects of heat and dust (and lots more!).
In observations with more coarse instruments where many different signals can be detected, the distinction between noise and signal becomes blurry. Consider a radio station which is overlapped by several other stations at a time, as is common between large metropolitan areas. One station is probably louder than the rest and would be easily distinguishable by itself but the overlapping signals from other stations make listening difficult. This is a case of certain signals becoming undesirable noise. If you had a directional antenna you could turn it until your desired station was much louder -spatially resolving the signal.
Like a dipole radio antenna, GW telescopes are usually all-sky detectors. If there are two sources which are spatially unresolved and are close in frequency then the sources become confused together and not much can be learned the individual source. Resolution of each parameter such as frequency and sky position is a function of the number of data points. If the source is faint, the resolution decreases. One find the limit below which, two sources within a certain parameter distance cannot be distinguished from each other. These sources then become a kind of noise. Thus if there is a large number of these indistinguishable sources, the noise level rises.
Noise can also be thought of as contributing to measurement error. In the case of multiple sources of noise,
each adds a gaussian? distribution of a certain width. The total noise is the quadratic sum of the widths. If the noise has a zero mean, then it is also the quadratic sum of the rms values.

In many cases the distinction is obvious. For example a CCD image of a star will be the sum of the effect of the starlight on the camera plus the effects of heat and dust (and lots more!).In observations with more coarse instruments where many different signals can be detected, the distinction between noise and signal becomes blurry. Consider a radio station which is overlapped by several other stations at a time, as is common between large metropolitan areas. One station is probably louder than the rest and would be easily distinguishable by itself but the overlapping signals from other stations make listening difficult. This is a case of certain signals becoming undesirable noise. If you had a directional antenna you could turn it until your desired station was much louder -spatially resolving the signal.
Like a dipole radio antenna, GW telescopes are usually all-sky detectors. If there are two sources which are spatially unresolved and are close in frequency then the sources become confused together and not much can be learned the individual source. Resolution of each parameter such as frequency and sky position is a function of the number of data points. If the source is faint, the resolution decreases. One find the limit below which, two sources within a certain parameter distance cannot be distinguished from each other. These sources then become a kind of noise. Thus if there is a large number of these indistinguishable sources, the noise level rises.
Noise can also be thought of as contributing to measurement error. In the case of multiple sources of noise,
each adds a gaussian? distribution of a certain width. The total noise is the quadratic sum of the widths. If the noise has a zero mean, then it is also the quadratic sum of the rms values.
posted by Danny at 11:10 AM
0 comments
